YORKSHIRE:HARROGATE, WHARFEDALE, ILKLEY:OLD ORDNANCE MAP 1920 ' S ELLIS MARTIN COVER

Item History & Price
VINTAGEMAP- SOLD FOR £17 ONLY- NO AUCTION- NO POSTAGE FEE FOR 2ND CLASS UK. "APERSPECTIVE ON BRITAIN: TRAVEL WITH AN ANTIQUE OR VINTAGE MAP"SELLER'SCODE: 100120183
THISIS AN ANTIQUE/ VINTAGE LINEN BACKEDORDNANCESURVEY MAP:
HARROGATESERIES4WITHTHEICONICELLISMARTIN PICTURE COVER
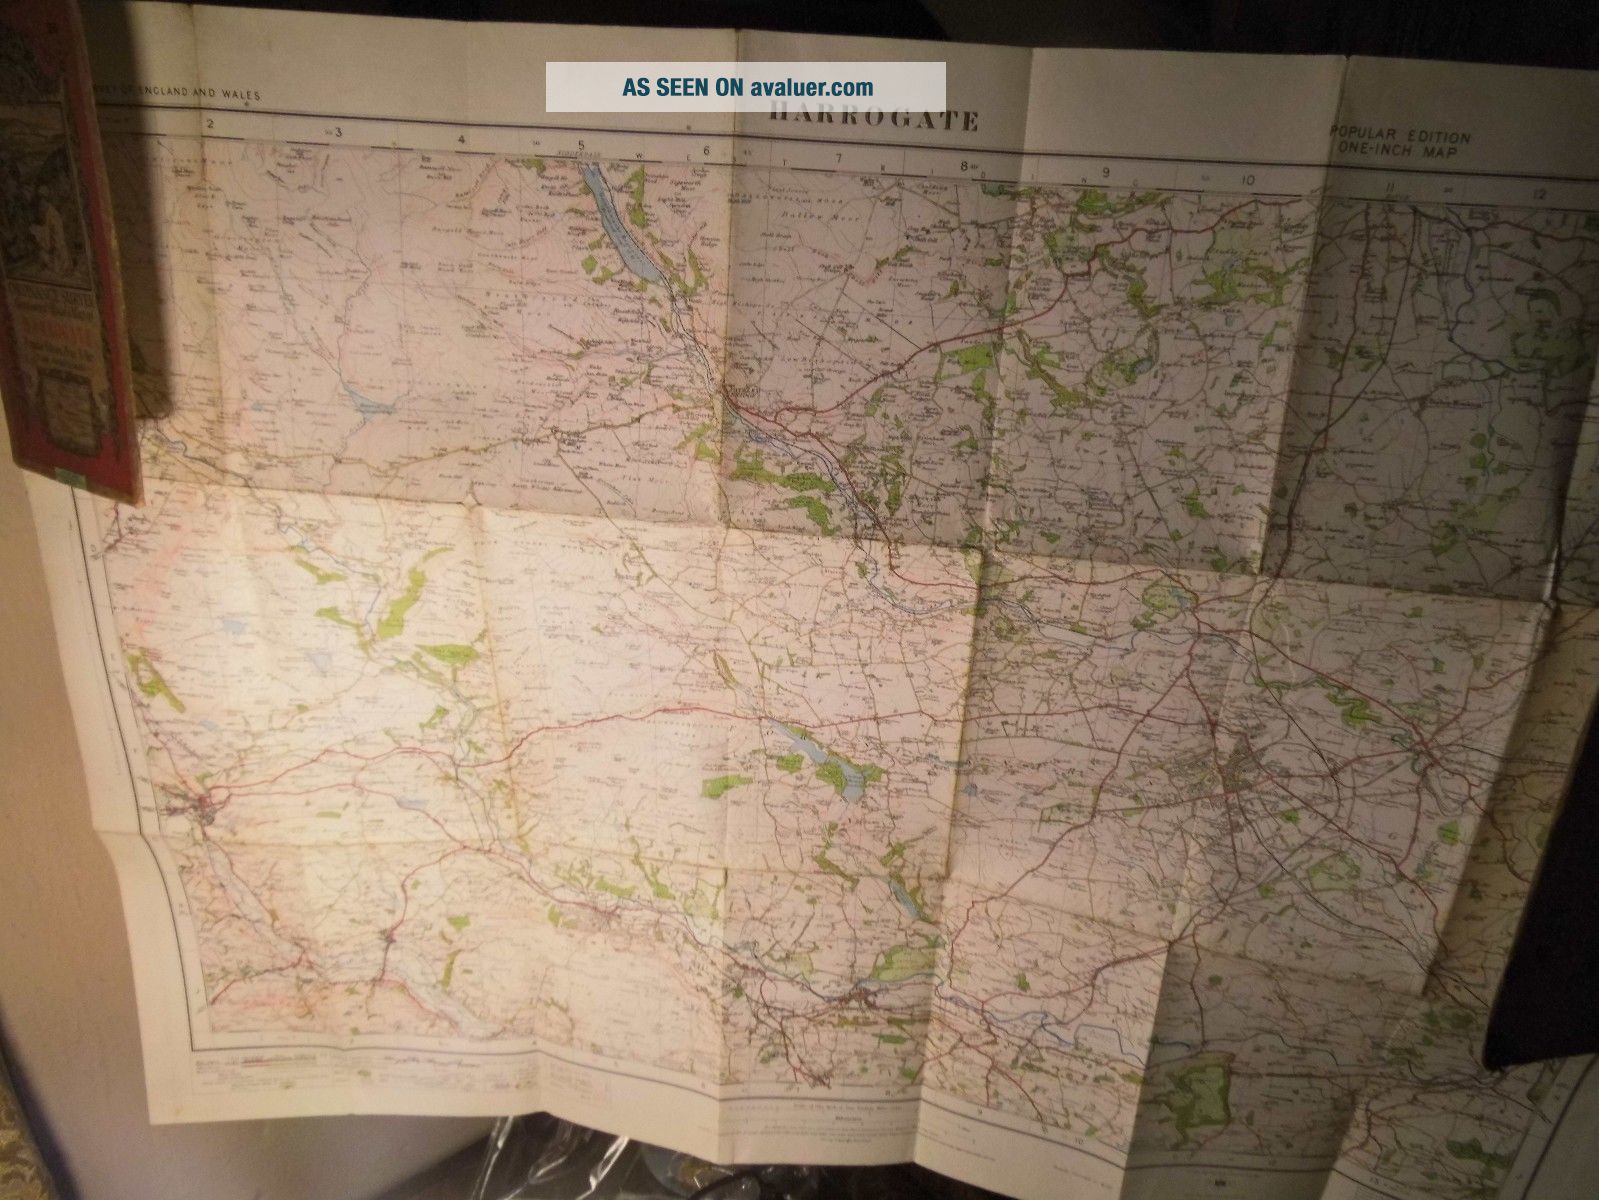
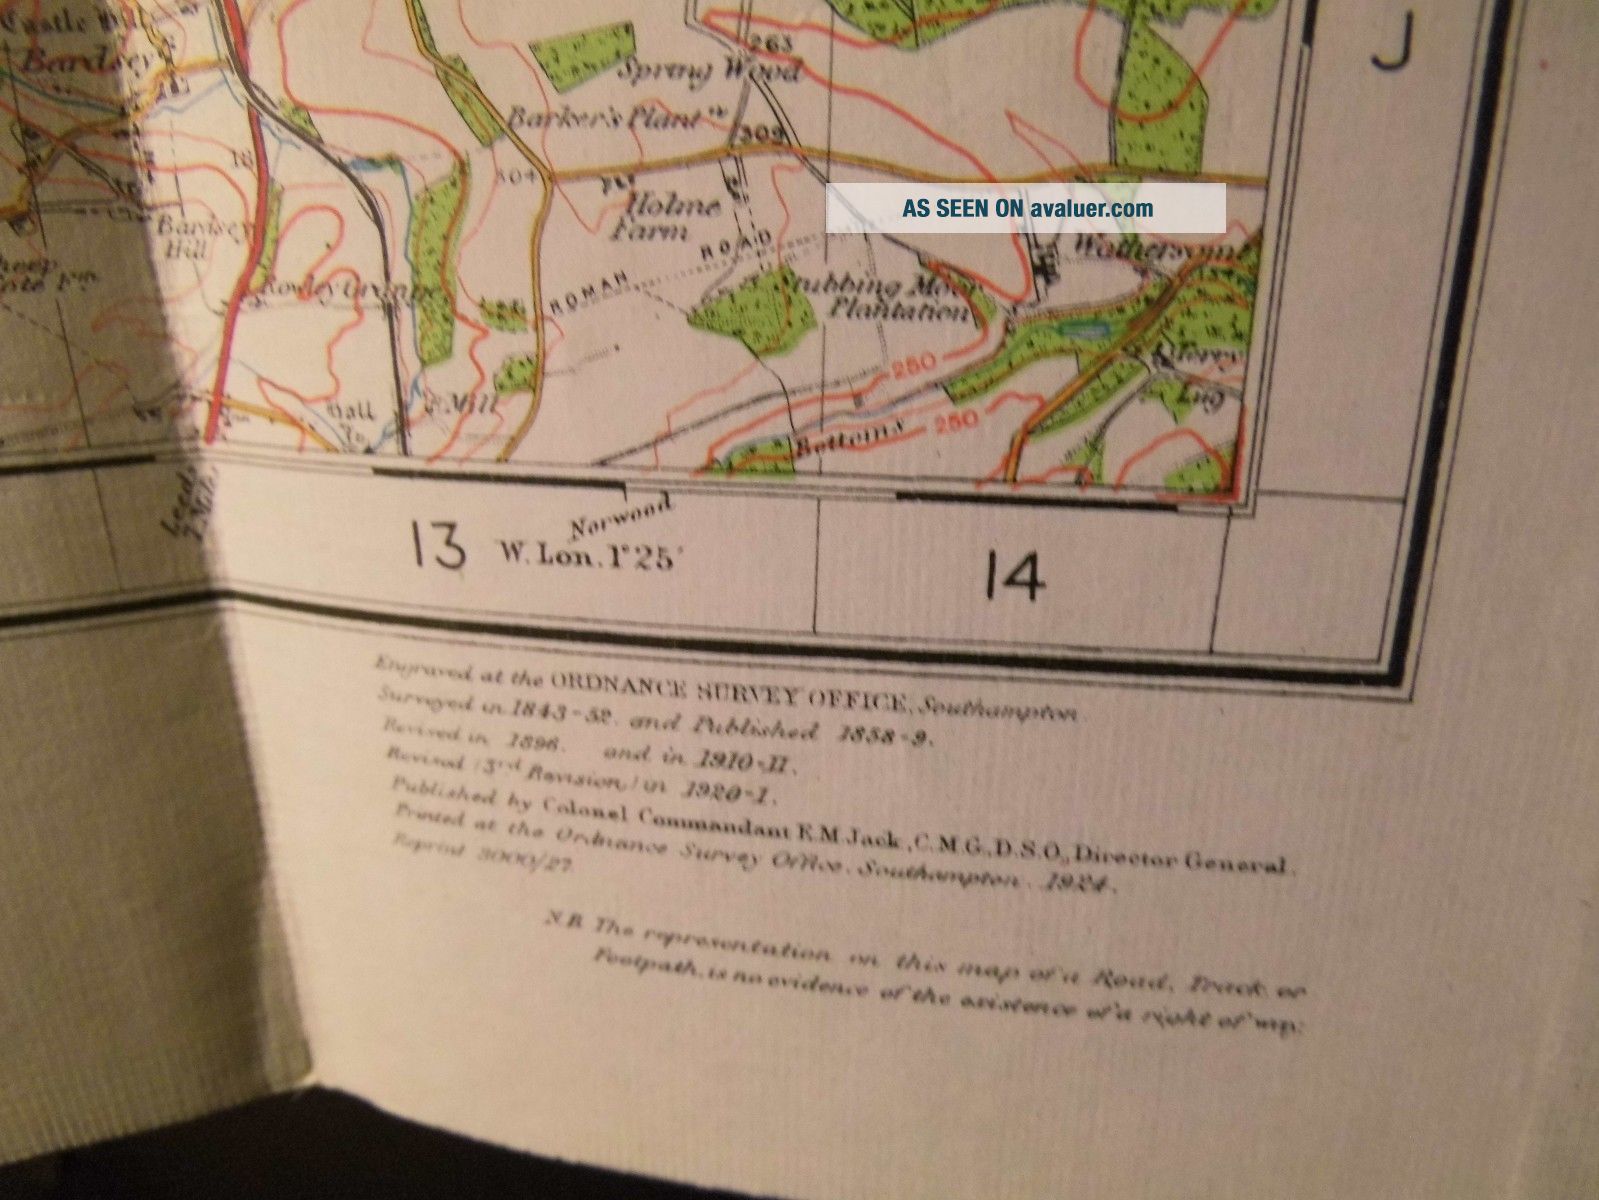
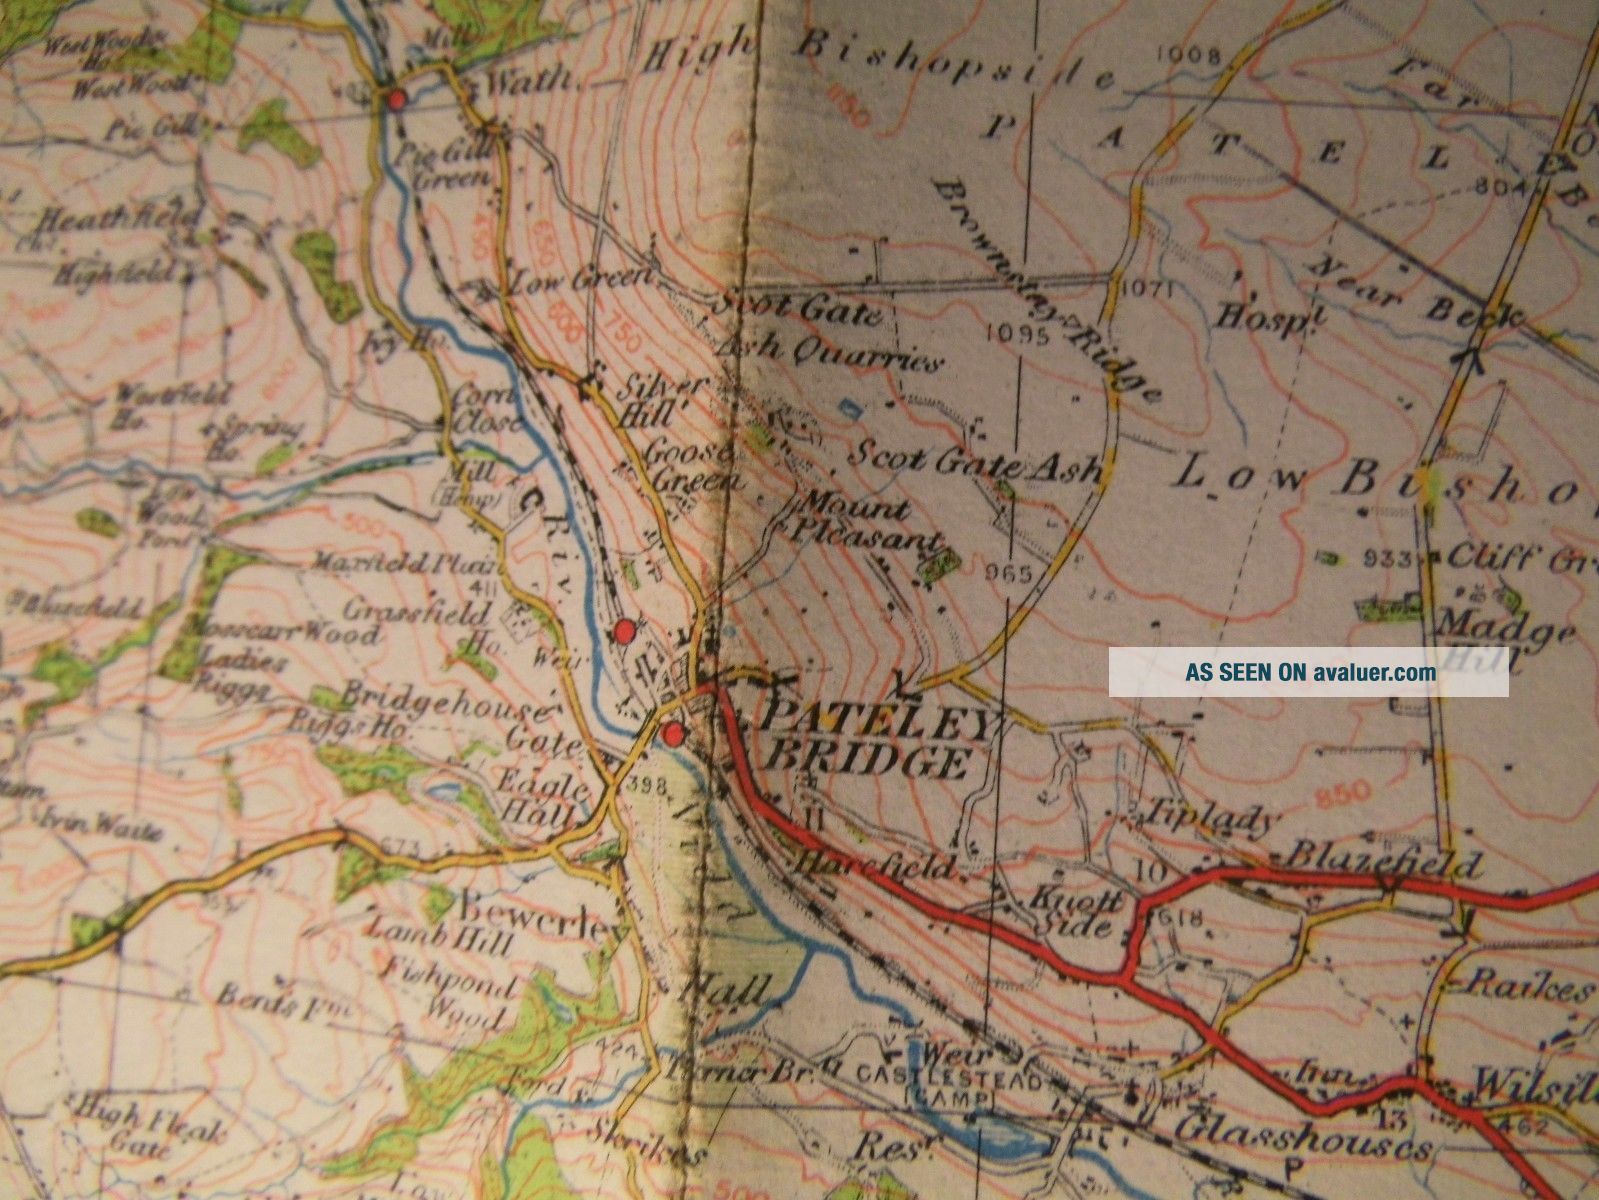
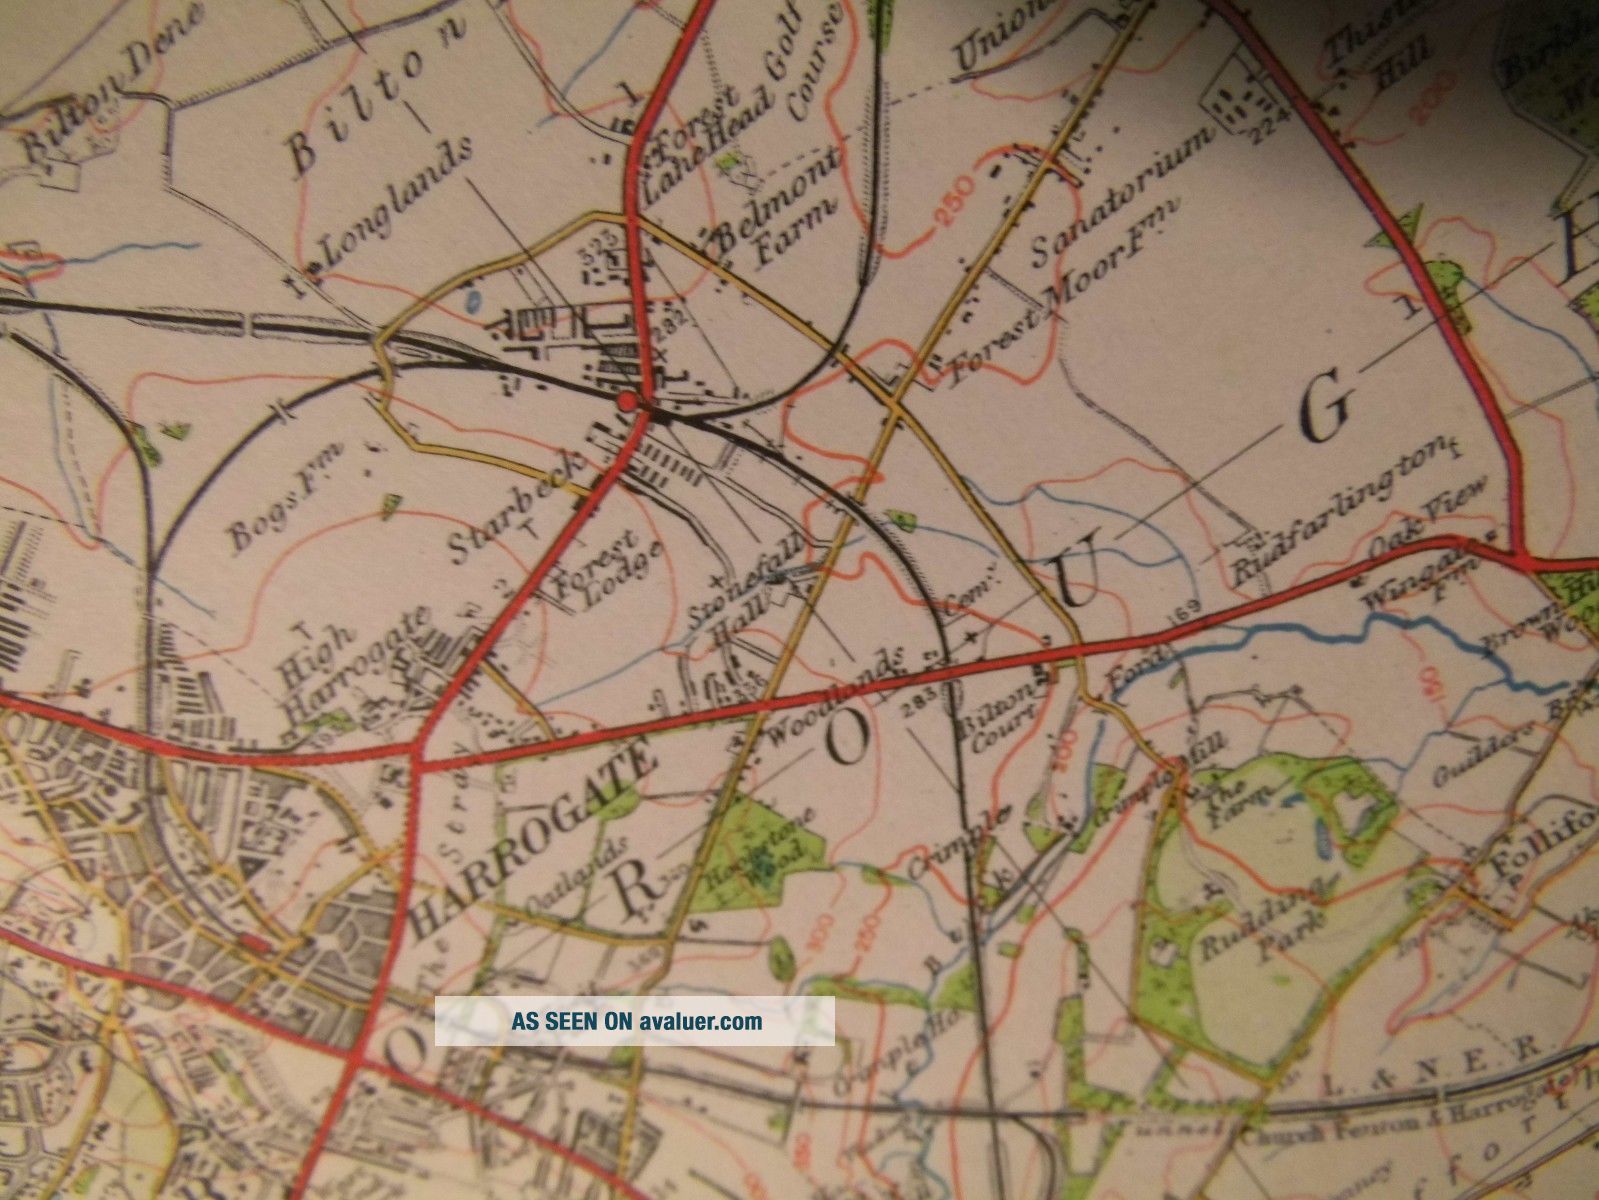
A1 INCH TO THE MILE SCALE MAPSurveys:1843-52, Revision1896- 1910-11THEN1920-21Printed1924 then in 1927 when 3, 000 copies only were made.The map scale is right for cycling and wal...king: theprinting is clear, sharp and probably still with an electrotypeintaglio base. They were perhaps the high point of Ordnance Surveycartography and important in that the OS turns its attention from aCivil Service and Military use to an attempt to be of use to thepublic. The Ellis Martin Covers made thee maps particularlysuccessful and collected.A SHORT DESCRIPTION OFTHIS MAPHere is Harrogate east of the centre of the mapwith Ilkley in the south west and Otley due south.The region is called the Forest of Knaresboroughand it is worth noting that many of the places have the suffix “-ley”implying clearings in a now lost woodland.Harrow in Middlesex takes it name from a PreChristian temple: but here the first element is Har Low from a nearbyhill: “Grey Hill” and the “Gaet” is a Norse “road” or aSaxon “pass”.The Railway runs up towards Pateley Bridge inNidderdale and continues north of the lake there which is a Bradfordwater Company reservoir. On this map there are two stations atPateley bridge which you have to walk between because the line has abreak: I wonder why that is.. Down at Harrogate the railways describeexaggerated loops round the east of the town and are probably allL&NER lines- but have not been for long for that company wasfully formed only in 1923.Interestingly Ilkley is called “Olicana” here-which I have not noticed on other maps. So the “Ilk” bit wasthought to be a Saxon version of a British cum Roman name. I don’tthink that is actually true. The Oxford etymologists see this as a“Leah” belonging to a certain Hillic or Illic. The Roman name issome academic associating the town with Ptolemy's map which had an“Olikana" on it. If this Saxon was called Hyllehama: hisnickname was “Grass-hopper”. Otley is Otta’s Leah, andpresumably he was named after the animal; Otter = Otor in Saxon.A Roman Road crosses the map west to east, but itis not certain that it passes through Harrogate: it might miss it tothe north.This was E Hudson’s map: he signs the cover. Hecame from Burnley because he bought this map of "LuptonBrothers" of Burnley, their label is centre bottom on the frontcover. He probably cycled to Harrogate with this map in 1927.The large river west and south on the map is theWharfe, and in the north east is the Ure, which I think is the riverwhich flows down Wensleydale – formerly called Uredale.Fells rise to above 1600 ft in the north west andthe Wharfe is already a substantial river when it enters the mapthere.Skipton in the west is served by the L&NER andalso the LM&SR and the valley running south east from there isthat of the Aire.There are some unusual names on this map Blubberhouses is one by Swinsty reservoir and another isAppletreewick:It is odd how many Saxon names citing apples are inthe north and north east- yet apples today are associated with Kent, the Vale of Evesham and Somerset. It is as if the fruit has migratedsouth and west: climate change?In the east of the map at Boroughbridge andWetherby one is near the main roads north. York and its Vale are 16miles off east from Wetherby. The Nid like the Wharfe and Ure flowsoff south east as do most great northern rivers and the Eden has thesame alignment- though running north-west. Only the Lune and Ribble, off in the west, break that pattern which must have been establishedby ice-flow or some tectonic event in the past. It is quite atvariance with Scotland where the major fault lines all run northeast–south west.It is an interesting fact on this 1920’s map thatall the lakes and standing water of the map are artificial. Harrogateis the most important spa town of Northern England: in some regards anorthern “Bath”: and the similarity might be greater if a Romanorigin were proved.The RHS garden is north east of the town but postdates this map.
MAPSTATS:OLDMAPSHOP.CO.UK : IS MY SOURCE ONLINE FOR MAP & CARTOGRAPHIC HISTORY
TITLE: Harrogate No 26 DATES:1843-1927- The Red Classic 1”Ellis Martin series PUBLISHER:Ordnance Survey EDITION: 1inch Series 4, Ellis Martincover PRINTER:Ordnance Survey, SOUTHAMPTON PRINTINGCODE: 3, 000/27PRINTINGPROCESS: (best guess) perhaps electrotype intaglio base with letterpress colour: verydifferent in process from the obvious lithography of Series 5SCALE:1 inch to the mile GRID: 2mile OVERALLDIMENSIONS: Roughly 28 inchesby 20 inches. COVERDIMENSIONS: 7½ inches by 4 ½ inches COVERDETAIL: Ellis Martin image floating: card, buff, red with black lettering cartouche map and Royal Arms – backcover shows index map of the series COVERCONDITION: light edge wear, complete, a former owner’s name fromthe 1920’sMAPPAPER OR LINEN BACKED: linen backed FOLDWEAR: minor EDGENICKS: few PINHOLES AT FOLD JUNCTIONS: someVERSO:Plain linen FOXING: notseen REINFORCING:noSURFACEMARKING: minor FOLDEDINTO: 21 sections ANNOTATION: covernameINTEREST:considerable: LM&SR inthe west but L&NER over most of the map and its 5 lines toHarrogate. Wharf and Ure seen in the Pennines, Spa Towns anddebatable Roman name attributions. Reservoirs for Bradford and Leeds, Roman Roads and remnant woodland in the river valleysGENERALCONDITION: good THENORTH WEST CORNER OF THIS MAP IS AT: ConistoneMoorTHENORTH EAST CORNER OF THIS MAP IS AT: RookerHall near BoroughbridgeTHESOUTH EAST CORNER OF THIS MAP IS AT: Wathersomenear RigtonTHESOUTH WEST CORNER OF THIS MAP IS AT: EarlCrag overlooks Sutton and GlusburnTHE CENTREOF THIS MAP IS AT: MenwithHill, Mount Bark, Forest Moor
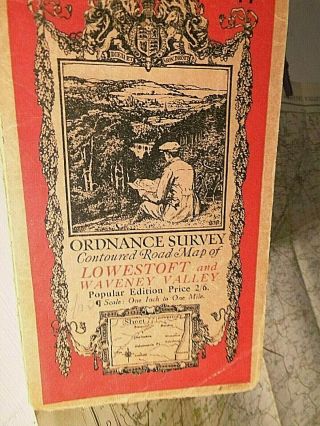
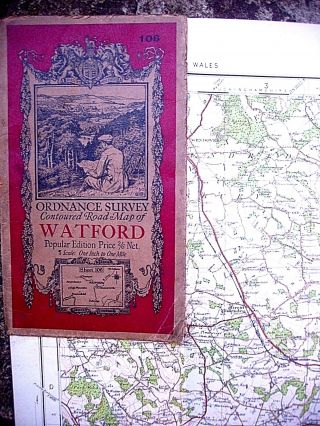
THEELLIS MARTIN COVERHereis an idyllic landscape and distant coast which could be in manyplaces in England and Wales. Cliffs frame an estuary and a woodedvalley is in the middle ground. A man, a cyclist, sits on a hill andsurveys the scene and his map. His bicycle is propped against thebushes to his right. He was a tweed cap, a tweed jacket and gaiterswith plus fours- he studies his map. He looks a bit like a civilianversion of figures one sees from the 1st World War- and that isprobably what he represents- a person who endured the trenches, now acivilian in an idyllic English or Welsh landscape. He has a pipe.Ellis Martin signed these early pictures on the bottom right EM.Itis a poignant and evocative image contrasting, in the viewers mind, the recent Great War with the peaceful bucolic landscape depicted.Ellis Martin was a war artist attached to two regiments (and corps)in the Great War and so there is a element of this image which mightbe autobiographical.
EllisMartin was born in 1881 and died in 1977. He was the house designerof the Ordnance Survey from about 1913 (aged 33) through to the2nd War in 1939. His greatly respected covers havebecome collectors items in their own right and his employment was apush by the OS to popularise their maps- both for commercial reasonsand out of a sense of moral duty after the Great War. The first OScover I know of was a Rolls Royce type open tourer on 1/4” motormaps which first appeared in 1913. Ellis Martin, before the FirstWorld War, produced posters and advertising designs for Selfridge'sand W.H. Smith and others. When the Great War broke out he went toFrance with the Royal Engineers and the Tank Corps, as an artistsketching the landscapes over which the army and its heavy vehicleswould have to move. When the war ended, Martin was invited to jointhe Ordnance Survey which was struggling to enter the growing marketin maps for ordinary people; and within a year the OS was reportingthe highest map sales in its history. Martin helped make OrdnanceSurvey a household name; his cover designs are much collected today.He was 96 when he died as recently as 1977.
CARTOGRAPHYThisis Series 4 Ordnance Survey. The scale is 1 inch too the mile. Thefine stipple and black base plate suggests that, in part the map isstill intaglio and perhaps can be seen as the last of that history ofengraved maps. The colour could also use a gravure process butblanket tone is more likely to have been Letterpress. There is amarked difference in stile between this series and the next: theSeries 5 blue covered Ellis Martin maps of the 1930’s. In those onecan see the opaque lithography which is the mark of the Series 6 andsubsequent series.Woodsare lime green with tree symbols: later the symbols vanished and justthe colour remained to depict tree cover.Notethat the inland water is still hatch shaded, not blanket tone at thisage.Contoursare orange and close: some are surveyed and others are interpolated.In places where the hills are steep contours can give a suggestion ofrelief shading. The grid is 2 inch and the measure along the marginsis in degrees and minutes but the National Grid in kilometres has notyet been established. The map gives scales in miles and kilometresand it is possible that the OS were surveyed in metric measurementsbut their public maps still presented imperial. It was the Army whichinstigated the metric Cassini grid, at about the same period as thismap: The Army was “metric” long before it was used on commercialmaps.Theprojection used by the OS was a Transverse Mercator: but they seldomstate the datum for that. A standard Mercator projection uses theEquator as its latitude datum and this distorts as one travels northor south: so much so that it is impractical at the latitude of thiscountry: So a transverse Mercator is used: more suitable for here.The interesting trick of the Mercator Projection is that, althoughthe map distorts laterally, a compass bearing plotted across the mapis still correct.
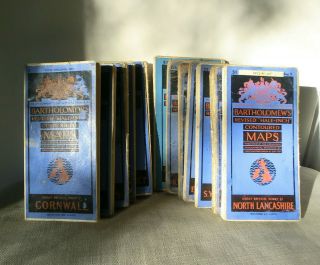
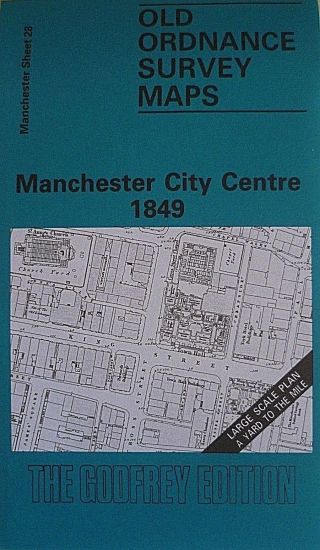
XXXXXXXXFollowingnotes are not essential reading for the purchase of the item- theyare added for interest if wanted:TheFirst OS Maps:Thefirst Trigonometrical Survey was in 1791; beginning, near modernHeathrow Airport, on Hounslow Heath- so Surrey, Berkshire andMiddlesex may well have been some of the earliest surveyed regions.In 1784 General William Roy measures out that first baseline of whatwould become the Ordnance Survey. It ran across Hounslow Heath, passing through Feltham. General Roy is commemorated locally in thename of a public house. The Ministry of Defence Geographic Centrestill has a base in Feltham, used as a government mapping office.Mapswere drawn then engraved for publication. The early presses were inthe Tower of London. The first plates were engraved copper - cold cutwith a burin. A burin being the engraver's cutting tool. Electrotypeswere introduced in about 1850, as the copper plates began to wearout. Colonel Mudge was the first Director of the Ordnance Survey.Benjamin Baker was the first printmaker. Mudge was charged with mapmaking for military purposes and Kent was the county of most concern;it was later, under Colby his successor, that the idea of rolling theSurvey out from Kent northwards to cover the whole country cameabout. In 1863 the sale of the maps was made more commercial; JamesGardner managed the operation from 163 Regent Street London. Theprinter at that time was Mr Ramshaw. Railways first appeared in 1842, so it is possible to find maps or copies of them with railways beforeelectrotyping- but generally the two phenomena came in together. DrHarley noted that “No copy of a pre-electrotype maps with railwayshas actually been located” - they are a kind of Holy Grail of O.S.mapping. From 1882 onwards revision became more frequent as newtowns, railways and features burgeoned. The First Series OrdnanceSurvey was finished in 1873 and the last map of the series was thatof the Isle of Man. The maps were not then intended for popularuse and one sheet cost the equivalent of two day's average wages. Theprint runs of the 1st series were modest: never more than 1, 000. Itwas this that gave an opening for Bartholomew to popularise theSurvey with 1/2 inch Reduced Ordnance Surveys. They were forced tochange their title to "Half in Reduced Survey" in 1911 whenthe Copyright Act was reinforced.Onelectrotypes in the period 1852+ the original engraver and directorwere still cited usually Lieut. Col. Mudge or Colby of the RoyalEngineers and Mr Benjamin Baker. Sometimes a “writer” is named attop right. They generally state “At the Ordnance Survey Office inthe Tower”. The numbering of the Sheets is always in RomanNumerals. Although the history books say this electrotyping was 1852+all those I have personally touched have been 1872-73. Often severalplates were tipped together forming quite huge linen backed sheetsoften about 26 inches by 50 inches- nearly always seen dissected andmounted in sections by London bespoke map preparers. The old Series 1was monochrome but bespoke preparations often have watercolour washas ordered. To give some notion of timing: the Series 1 map of Sussexis dated 1813 and that of Hereford is dated 1832. The series wasrolled out from the South East as stated.RAILWAYS:IstSeries OS maps showed railways on the revised electrotyped platesintroduced from the 1850s onwards. Railway Companies are un namedfrom Serioes 7 onwards- that is: from the 1950s; before that date, railway companies were named by their lines – LMSR, LNER, GWR, Southern Railway etc.. After that date- the network became BritishRailways and no name was necessary. Pre and Post World War 2 mapsgive the regional railway companies, and name individual lines.Railwayclosures can, be old- several closed prior to the 2nd WorldWar, a few earlier in the century. The manner for mapping closed andclosing railways seems to have be:1.Open; 2. Open but not public carriage; 3.Track marked stations inWhite; 4. Track bed marked in dashed line, cuttings shown, stationsomitted; 5. Cuttings only as geographical features. 5. Much later, Pathfinder 2 1/2” maps show “track of old railway” as agreen-way when it had become a leisure feature of the landscape.Closedstations are marked white, open stations are red. A closed series ofstations does not prove a closed line which might be open for freighttraffic only, or passenger traffic which now by-passes these oldhalts. War time maps seem sometimes to show stations closed for theduration which were re-opened after the War.CANALSDisusedcanals are similarly marked as disused, dry canal beds, and laterjust remnant bridges and surviving reaches. Unlike railways, thecanal network has seen its closures being slowly reversed- a recentexample is the Wey and Aran Navigation.GENERALCivilianOS tends to use red for major roads, where as Military maps tended touse ochre- a major aesthetic difference. Interestingly, even onearlier maps, where all references are in miles, the grid is notImperial but Metric. The Kilometre square seems to be much earlier inOS surveying than in popular use. Indeed there is no popular use ofthe Kilometre as an English land measure- but it is probably that thesurvey never used anything else in the 20th century. For example on a1959 sheet one finds a kilometre measure, a mile measure, a kilometregrid but all references of distance where routes leave the map edgeare in miles. The trend towards citing metric distance was reversedin the later Pathfinder series, it was part of a generalsocio-political change in which enthusiasm for ever closer Europeanstandardisation ebbed and the impetus to change popular usage washalted .Thereseems to have been a major aesthetic change in the 1960 Survey whenthe detail on the maps was simplified and drawn in a bolder manner.Prior to that, civilian OS and military OS were generally similar, though the gridding methods were different. The Civilian Map Grid wasBlack not Purple or Blue. The Military field sheet-map was almostalways smaller than the Civilian one, and used non-standard coloursand paper- because many printers were coopted for the War time work.REDACTIONIthas been alleged that OS add deliberate errors to maps to guardagainst copyright infringement- and it is fun to try to spot these-if they exist. War time maps exclude sites of military significance, Airbases were usually redacted but Army camps were generally not.Naval Ports were left blank and white. One local 1 inch war sheets, churches were unmarked as were other important buildings which mighthave been useful to an enemy for navigation. Perhaps barracks andcamps were unamended because they dated from the Pre war period andwould have been readily available to an enemy from older maps.Airfield were a different matter.THEFULL RANGE OF SCALES USEDThefollowing were listed in a 1908 O.S. cover as being the publishedmaps of the time:“Townmaps on a scale of ten feet or five feet to a mile; General CadastralMap on a scale of 1/2500 or 25 inches to the mile; General map on ascale of 6 inches to the mile; General map on the scale of one mileto an inch; .General map on the scale of two miles to an Inch;General map on the scale of four miles to an inch; General Map of theUnited Kingdom 1/1000000 or 16 miles to an inch; The 10ft, 5 ft and 6inch maps are black only; A full sheet is 36” X 24”, a ¼ sheetis 18” x 12”; The 1, 4, & 10 mile maps are published in blackalso; Contours are on 1 and 2 mile maps; Special maps of certaindistricts are published; All small scale maps can be had, mounted onlinen, unmounted, flat, folded in covers, or cut into sections andmounted on linen; Geographical maps are 6inch to the mile or 1 mileto an inch or 4 miles to an inch.”ONEINCH MAPS OF THE EARLY 20TH CENTURY:SERIES3 - one inchThe1 inch Contoured Road maps had a pictorial cover, often on abrick red ground with black and fawn designs with the borders. Theartist most seen was Ellis Martin and he worked in either pen and inkor woodblock on scenes of travellers by car or cycle. He signs EM atthe bottom corner of the early 1920s design, and his full name on the1930s version. The Full Survey dates for these maps up until 1930swas often surprisingly early : 1870s +. The format was 7” by 4 1/2”folded and the maps were often dissected, though OS used the term“mounted in sections”. Such were the economics of the time that aprice could be printed on the map cover. Integral pricing lasteduntil Series 7, by which time appliqué labels to alter printedprices were common. A contoured road map of 1919 in dissected formwas 3/6d. Its covers were in concertina form. The grid was 2” andnumbered west to east and lettered south to north. The numbers andletters named the squares of the grid not the lines of it. Each gridblock was of 4 square miles. Road were unnamed and railways showedtheir company names. The ½ inch series used an olive green coverinstead of Brick Red. Ellis Martin illustrated these too- His mostfamous 1” design showed a tweed-clad cyclist studying his map witha pipe in his mouth; his 1/2” touring map design was of an opentopped Rolls Royce like car with 3 passengers and a driver.Amap found from this series had the following interestingcharacteristics: Intaglio blue printing for the hydrography, intagliobrown printing for the uplands, intaglio Black line printing for theroads and towns and names, red contours like a Belgian InstituteCartographique Militaire map, which it resembled in severalcharacteristics. It had litho printed green for woods and lithoprinted orange for roads. Windmills, workhouses and smithies weremarked throughout; thus there was an supposition that horse drawncarriages would be the normal form of conveyance. Hydrography at seahad contours marked in feet not fathoms and a very fine coastalhydrographic shading used parallel blue engraved lines whichconverged towards the coast line, to shade the coastal waters darker.The railways named older pre regional companies – LB&SCR inthis case. It was linen backed and the sheet was about 30 inches by20 inches between floating white linen covered boards- a mostattractive but rarely seen series. (Map described was No. 137-Brighton Lewes Eastbourne).THEEARLY ELLIS MARTIN COVER DESIGNEllisMartin was the first professional cover artist employed by theOrdnance Survey. The purpose was to popularise the maps, the effectwas startling. The highest ever map sales were achieved in the year1921 and Ellis Martin's colourful covers were largely responsible.Usually set within a red brown cover and an elaborate festooned leafborder; the Royal Arms crowned the image. The picture by EllisMartin- showed a man in Tweed Cap, pipe in mouth, and cyclinggaiters, sat on sloping grass studying a map from a hill-side withhis bicycle propped to his right- In front of him is a genericidealised English landscape. In the distance is a bay andcliffs. In the middle distance a viaduct crosses a river and hillsdescend to its valley. At the base of the hill woodland frames theimage. The artist signs the 1920s covers “EM” at bottom right.One would guess from the mark making that the original was an inkdrawing rather than woodblock. Of the Popular Edition of 1919-1921Nicholas Crane, historian and broadcaster noted" This representsthe last view of Britain before it was over-run" (by themotorcar) Timeshift, BBC Sept 2015.Series5 - 1 inchGenerally, these have a blue cover and on them the famous Ellis Martin cover isupdated to show a man of the 1930s- the cycle is gone as is the hat, and the Tweed jacket. His hair is in the short sided manner of the1930s. He still smokes his pipe but now has a short sleeved cardigan, a shirt with sleeves rolled up and a ruck sack on his back- Thecyclist has become a hiker. Otherwise the landscape of the image isunchanged, as is the rest of the cover lay out. The artist signsthese 1930s covers “Ellis Martin”. Series 5 maps are often ofmore localised areas than Series 4. They are seldom seen; perhapstheir production was quickly compromised and curtailed by theoutbreak of war. The implication here is that the golden age of cycletouring is over- This man may be a car driver- his exploration of thecountryside is on foot. Series 5 maps were often large- 40 incheswide.6thSERIES 1 inch6thSeries Northern England and Wales maps were based on the Survey forthe 4th edition; but Southern England and Wales, (South ofBirmingham), were based on the 5th edition. From the 5th series onthe maps were based on Lithographic masters (stone or zinc)- earlierthese had been engraved. So, interestingly, Northern England andWales 6th Series were still based on engraved masters, where as 6thseries Southern England and Wales maps were based on masters whichwere already lithographic. In this 6th series M.O.T. road numberswere marked in red. Parish boundaries were re-established after aperiod of omission. Briefly a rather thick brown parish line wastried which compromised streams and other marks- this was quicklyabandoned- I cite the Snowdon Map of 1918-1947 an an example of itsuse.OnSeries 6 maps, the 1 kilometre National Grid was used for the firsttime. Work on the series began in the 1930s and was interrupted bywar when all the effort of the OS went into Overseas mapping an WarOffice sheets. Then much preparatory work was lost in bombing raidsand, having been halted in an unfinished state, many of the plateshad not been photographed. Thus the maps which appeared as the “NewPopular Edition Series 6" in 1940- 1947 were much less “new”than had been intended as a result of the war damage to theChessington or Southampton offices and the terrible oversight in notphotographing working plates. When they first appeared the priceswere: paper flat 2/6d; Paper folded 3/-; Linen backed and folded 5/-;Mounted in sections on linen 10/6d. Scottish maps use the samemeridian and projection as England and Wales for the first time.Symbols appeared for National Trust, YHA, Wireless Masts, PylonLines, and Telephone Call Boxes. The only 6th Series Tourist map forwhich the reproduction material was not destroyed by enemy action wasthat of the Lake District. The other Tourist maps were recreated fromscratch after the war. As most 6th Series are published fromSouthampton, perhaps it was there that the Ordnance Survey lost somuch in Bombing raids.7thSERIES - 1 inchThesemaps generally appeared soon but not immediately after the war. The1945-47 maps were Series 6. Series 7 was the first truly PostWar survey- the survey revision work had mainly been carried out from1946 to 1957- and the publications were initially from 1952 to 60-revised up until near the end of the decade.OnSeries Severn Maps the war-time airfields were marked- usually justwith the work “Airfield” an no details. 2 1/2” maps are neededfor full runway and taxiway details. For this reason, Series 7 mapsare better for war research than the contemporary Series 6 pieces.This series is particularly useful for historians of the RAF FighterCommand and Bomber Command , USAAF, RCAF, RNZAF and RAAF.Thereare two formats. The earlier ones, from the end of the war have afolded format of 7 ¾ inches by 5 inches, they look noticeabledumpier and thicker. The later format was 8 ¼ inches by 5 inches.The sheet sizes were standard and did not alter- the difference layin the folding, with the 1950 era maps having the map details orlegend strip at the bottom folded-in before the main map was folded.The later format included the whole sheet in the main folds. Anotherage differentiator is the use of gloss covers. Generally these werelater. Thus there are three instantly recognisable types for the 7thseries Post War: (a.) Dumpy, matt cover with legend folded in; and (b.) Larger folded size, matt cover, whole sheet folded together. c.Large folded size, gloss cover, whole sheet folded together. By the7th Series, the railways were nationalised under British Railways andso the old company names disappeared. Closures had begun but Series 7shows the full network, even if stationed are marked white - that is:closed. One cannot tell if a line so marked was fully closed or opento freight traffic only. It should be noted that the popular notionof “Beeching Cuts” is a simplification; it is quite apparent onSeries 6 maps that many lines were already closing in the 1940s.OnSeries 7 maps, Britain is seen before the motorway network. TheOld fighter aerodromes are still shown, but not necessarily theoperational ones. The following aesthetic changes from Series 6can be seen: Woodland is apple green, not lime green. Urban areas aregrey blocked, not black blocked. “A” roads are thinner, lessvermilion, more crimson and they are numbered in red not black. “B”Roads are thinner, less ochre and more yellow and remain unnumbered.Tidal banks, bays and hydrographic features are marked in blueletters, not black. Contours are thinner and look lighter. Streamsand rivers seem a little brighter blue- cobalt rather than tertiary.Orchards and plantations have a lighter and more widely spread symbolof trees in grey. Prices are no longer printed on the map legend.Towards the end of the 1960s the 1 inch series was printed in a plainred gloss cover with black lettering-this late series had aprovisional look.7thSeries ½ Inch Green Covered OS maps:Anunusual. Perhaps provisional OS series. They used classic OScartography with a very light toning in three colours and tan contourlines and colour also used for land-use so the series does not havethe geological or “orographic” colouring of OS road maps andBartholomew maps. This seems to be an experimental colouring form andit may not have endured long in published OS series. This seriesgives a very fine overall perspective of a region. Some detail waslost due to scale- notably orchards and plantations and minor streamnames. But the hydrographic structure generally shows up better onthis broader scale. There are aspects of the 1/2” series of the1950s which suggests a much older template. Perhaps the Green ½ inchmaps looked back to an earlier manner- perhaps that of the 1930s oreven 1920s. Roads maintain a standard form irrespective of map scale-thus they dominate a 1/2 inch map more than a 1 inch map. This is ageneral characteristic of all small scale maps. Airportsare generally absent- either due to war-time redaction which has notbeen reversed, or an older template which pre-dated theyestablishment. There are 51 in the series with Shetland being No 1.and Kent No 51. A standard sale price was 3/- for the paper map.
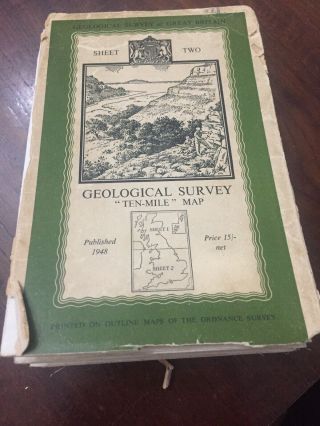
Victorian¼ inch Maps:Thesewere reduced from 2 standard sheets- such as “Kent and East Sussex-sheets 20 & 24”. They were small scale, measuring about 20inches by 24 inches with usually simple red cloth covers whichfloated. They had no contours and showed hills with umber shading.They had a 10 minute Mercator grid- and showed roads in burnt orange, woodland in green and the sea without submarine contours in a greenblue which toned darker towards the coast. Railway companies werenamed: they were travelling maps for carriage tours, cycle tours ortrain journeys. They took Liverpool LWMMT as the datum. Typical datesfor the late Victorian-Edwardian series would be: Revised 1887-1894;Railways correct to 1905. They are particularly good for studying therelative growth of towns, woodland cover (usually reduced by today'smeasure) and overall coastal change. Their form and presentation is aprecursor of the Tourist Maps.¼”Pre War, 3RD Edition Pocket Maps – For Motorcyclists ( &motorists):Thesehad boarded covers-which concertina the map between them. Front coverin black and tertiary blue on fawn with classic image of a motorcyclist studying his map by a road sign, in a peaked tweed cap, goggles, a double breasted tweed jacket and a Pre-1st War machinewith a camphor lamp on a bracket square tank. Boards measure 7 ½”by 4 ¼” with G.R. Royal Arms (George V) at bottom front cover.Published from Southampton. Director General of the period cited:Colonel Commandant E M Jack CMG DSO. The map on linen cost 3/-, orPaper 2/-. The Grid is 2”; squares representing 8 miles or 64square miles; one of the last non-metric grids published by theOrdnance Survey. All the Inter-War railways were named; jointlyoperated railway lines are marked as such. These are Geographicalmaps and show contours with graded colour , like a Bartholomew Map.The two publishers were in direct competition but Bartholomew used a½ inch to the mile scale. Bartholomew covered more local regions-such as “Essex”; and Bartholomew were endorsed by the CyclistTouring Club whose logo appeared on their map. Ordnance Survey optedfor the smaller scale and pitched the map at motor-cyclists. They aresimilar to the large format blue covered 1/4” maps but have thecounty names printed in bold black lettering and have grid letters Ato M down the sides, and numbers 1-15 across the bottom; a nonestandard system with no reference to the National Grid. Featuresmarked include: Mineral Railways, Tramways, Battles, Lightships andLighthouses and Seaplane Stations and aerodromes. These maps areoften interestingly annotated by motorcyclists of the period.Numbering was as for the 1/4” 3rd Series large maps with the letter“A” added: 1A to 12A, but missing out 5A. The Index Map suggeststhat they may not have been issued for Scotland- and also shows thatNos. 1, 3, 10, 11 (Borders, North Yorkshire, Cornwall & Devon, and the South) were not produced in this compact series. Map detailsstate that these were“Heliozincographed” which is “PhotoLithographed” . “Helio” means “using light” (i.e:photographically transferred) and “zincographed” means zinc-platelithography. (“litho” means stone, the material of the firstblocks.) Ordnance Survey and Bartholomew's were rivals for the drivermarket and used similar formulae. It was a battle which Bartholomewprobably won on cost and quantity. It is interesting how muchextraneous sea was included on some (example: Isle of Man-North WestEngland). This shows that any one O.S. Version is a by-product of agreater survey and project; the original raison d'etre having beenmilitary- not sight seeing by motor cycle.¼INCH MAPS: 4TH EDITIONTheseare large and blue-beige covered with the Royal Arms at the top frontcover. There were two series, one for Scotland and one for Englandand Wales. Scotland numbered 1-9 from the Borders to Shetland, andEngland and Wales numbered 1-12 from the Borders to SE England.Number 1 was shared between the two series and covered the wholeborder from Solway to Berwick. Oddly, there was no Map 5 in theEnglish Series and so England and Wales were covered by 11 maps. Map10- Cornwall and Devon is different from the rest in that it did notoverlap any other of the series at all. Scottish maps 8 and 9 werepublished together (Shetland and Orkney). The size folded was a large12 ½” x 5”. The sheets were about 33” by 27” , with thelegend border folded in separately, but they varied. Some, likeShetland, were much smaller. They were printed either portrait orlandscape depending on which suited the geography best. They also hasa sheet of city maps inside the back cover. This town map sheet was22” x 12”, black and red on white and printed on recto and verso;it sometimes contained other information, for example: Sheet 4 showsMersey Tunnel Charge. Typical dates were: Full Revision 1919- printed1946 (4) so the print date equated with the 6th series 1” but theMaster used was much earlier and would have been engraved orelectrotyped- not lithographic. These maps have “orographic”colour gradation to show altitude and contour, they also have roadnumbers; it is apparent that they were going head to head withBartholomew for the traveller and tourist and came up with a verysimilar manner of map making, but a very different large format-attractive but seemingly clumsy. In War time, these ¼ maps aresometimes found marked by flyers- particularly, on suspects, by AirTransport and Delivery pilots. These maps have Level Crossingspredominantly marked in red because pilots followed railway lines andused level crossings as points of reference.Original1940s Prices; Paper flat 3/-; Paper folded 5/-; Mounted on linen andfolded 8/-; An Outline only edition 3/-.2½ INCHES SERIESThe2 ½ inch small sheets are the best maps for local history, archaeological study and place-name study. They use black, blue andochre, not full OS colour and will show individual buildings, trees, local names but not all field names. They are either uncovered, bluepaper covered or blue glazed card covered. They measure about 18 ½inches by 19 ½ inches and the black grids on them are 1 ½ inches or4 cm across. They show and area of about 6 miles by 6 miles (36square miles), which is 100 km squared. The are number with 2 lettersand 2 digits: such as TQ35. Each large area of the country, such asTQ is divided into 80 of these very local 2 ½ inch map blocks. Themaps give farm names; they mark, but do not name, fields.2½ Inch 2nd Series (Green)Thisis a transitional series between the Blue single area format and thePathfinder double area format. The Cover graphics are as the gloss1st series 1:25000 maps showing a magnifying glass over a map. 1965is a standard copyright date. The series anticipates Pathfinder inthat the sheet is doubled longitudinally and the symbol legend is atthe left. But the manner and printing quality is similar to the 1stSeries without the “satin” feel or stark bleached paper of thelater maps. The verso is plain, footpaths are bold and green;buildings are grey and individually drawn, ancient sites are wellmarked, field boundaries are black: This is more rarely seen series-very pleasant maps on good paper. The standard price was 8 shillingsand 6d a sheet.Pathfinder2 ½ inch MapsThesewere introduced circa 1980 and had a different format- They werelarger, covering two of the old 2 ½” maps: Thus, for example, theOxford map is marked SP40/50 and covered the old maps SP40 and SP50.Early Pathfinders had no other letter or number codes, but soon a newnumbering system accompanied the Old letter and number grid: Example:“MONTGOMERY 909 : SO29/30.” One change is the return of Imperialscales, For a time from roughly 1960 onwards maps were described onlyas 1:25000, now “2 ½ inch to the Mile” makes a re appearance –perhaps by demand, because this means something; where as 1:25000 israther abstract. The versi were now plain, which they had not been inthe Provisional 1:25000 series, and the covers became Green and RosePink with Black and White lettering. Their printing differed fromearlier 2 1/2” as well: Wooded areas became block green with treesymbols in black- previously they had been white with tree symbols ina grey. Symbols for trees differentiated between Coniferous, Broadleaf, Coppice and Orchard- Orchards alone retained the whitebackground. The fonts changed too: Pathfinder lettering was RomanCapital Sans Serif and light. Older maps were Italic Capital andbold. Field boundaries where lined in a bold manner; previously theyhad been light grey. The orange contours lines were toned down andfootpaths/ bridleways marked in a bolder green. Watercourses were alighter blue and perhaps simplified with minor ponds being unmarked.The Fold format also changed from 24cm x 12cm to 24 cm x 12.5cm:seemingly minor but giving the folded map a markedly stockier look.The borders were changed: previously they had been white, now theywere the same pale green as the woodland with an outer border inwhite. The paper turned from cream to white.Underlyingall these subtle changes was a shift in emphasis- old 2 ½ inch mapswere documents of record with emphases on roads, altitude and watersources; perhaps land ownership and use was uppermost in thecartographer's mind. The Pathfinder's emphasis was on walking access-this had an advantage in the mapping of railways . Previously closedor closing railways used to undergo a gradual disappearance ending upwith vague cutting symbols in the landscape. - but on these walkingmaps, they became boldly displayed in white with black lined edges;they had, with social change, become green-ways and important aspectsof the countryside.Localfarm names were retained: but there appears to have been a change inthe marking of tumuli and barrows which were now named but not markedwith that circle of short dashes which had made then so prominent onthe older series.Overallthe effect is of a higher key map with less geological emphasis andmore right of way or leisure emphasis. The change from Capital BoldItalic to Light Roman Sans Serif, seemingly trivial, made a very bigaesthetic difference.2½ inch and its 1:25000 equivalentArethese the same? Technically no. The maths works out as follows: 1mile = 1760 yards, which is 5880 feet or 63360 inches. Divided by 2.5= 1: 25, 344. Which is the actual scale use on the map: 1:25, 000, or1:25, 344? The 1:25, 344 is the correct figure, the reference to milesis a convenient approximate for users. The 2 1/2 inch series wasundertaken initially between 1945 and 1962- it was an entirely PostWar exercise.GeologicalSurvey and Ordnance SurveyTherelationship between the two Surveys was close. The BASE MAPS of theGeological Survey of Great Britain were always Ordnance maps, be theynational or local. The definitive Great Britain Survey by the GSGB of1948 , which was produced in 2 sheets (North and South), was 10 milesto the inch and used a grey OS base map. The Ordnance Survey retainedprimary copyright on these maps, not the GSGB. The Ordnance Surveypublished a large scale pair of sheets showing the Ancient Sites ofBritain to accompany the Geological Survey- same format, also Northand South, numbered 1 & 2, and using a grey-blue map base withorographic colour in ochre shades. These maps were veryprofessionally produced with robust linen backs and were roughly 40inches by 32 inches- as were the two sheet Geological Survey maps.The image on the covers of the two Great Britain Geological Surveymaps of 1948 was very much in the manner of Ellis Martin but wassigned “RTR” at bottom right: It showed a similar idealisedEnglish landscape with two geologists at work with hammer and map.Acharacteristic of the accompanying 1951 Ancient Britain sheets wastheir conservatism- perhaps including only sites verified andsurveyed by themselves- Piltdown was one unfortunate inclusion.WarMaps:TheDirector of the Ordnance Survey in the 1st World War was ColonelClose. This war brought in the use of aerial mapping. Capt. HaroldWinterbottom was in charge of photo-observation from the air inthis war. 33 million maps and plans were produced by theOrdnance Survey for the British military during the Great War. TheSurvey lost 67 of its personnel in the war. These maps were printedby the Geographical Section of the General Staff and published by theWar Office- They have a different grid system to civilian maps –generally using purple lines and a reference system of vertical andhorizontal numbers- East is read first, then North. The western edgeof the square giving the East Co-ordinate and the south edge of thesquare gives the North Co-ordinate. Interestingly the Army used aProto-National Grid in kms from a datum off S.W.Cornwall since the1920s.TheRAF did not convert to metric- using nautical miles. Also the RAFoften did not receive its maps via the G.S.G.S. W.O. (General Staff, Geographical Service, War Office) but often directly from theOrdnance Survey. The Air Ministry used some standard OS maps such asthe 3 sheet 10 mile to the inch series and the ¼ inch series. Largerscale civilian maps were not suitable for flying but some Series 6 1”maps bear prominent red crosses on level crossings- suggesting thatthey had an auxillary use for flyers- perhaps for the ATA- many ofwhose flyers were women.Interestingly, Army military bearings conform neither to True North nor to GridNorth. On many of these maps, MILITARY details are often printedunder the map- on some, letters subdivide the chart. Some look cutdown but were issued without margins with coordinates printed acrossthe middle of the map. The General scale for the local Military mapsof the 2nd War is 1 mile to the inch. They are infull OS colour, but due to the many scratch printers used, thecolouring is non-standard and the paper quality is War Standard.Smaller scale general maps are often found with air navigators' handwritten marks- They must have been used by Air Transport Corps. Mapsknown to have been from Cranwell show that the RAF used 1” extractsfor general cartographic training and examination.OnGSGS WO maps, OS survey details are often given- original surveys canbe as early as 1865-78 and first publication often circa 1876-82-then constantly revised until these War Time printings by the WarOffice Geographical Service.Onetends to find, when dated, that the GSGS OS maps with purple grid are1930s surveys printed in War Revision of 1940 and the GSGS Blue Gridare generally 1940-42 prints of the 1940 War Revision.Thereis considerable difference in colour on OS War maps. Generally theolder and linen backed ones tend to use deeper lithographic colourand the paper and later maps tend towards muted lithographic colour.Tidal flats are shown in ochre on the former and often grey stippledon the latter. The blues of the fresh water and tidal water show thegreatest difference between the series: quite intense and ultramarineon some (earlier)- more tertiary on others (later).MilitaryMaps have no covers, but are folded sheets, linen backed or paper and- often with a pencil reference on the verso. Often those that wereused in the field had the edges folded back. A few were varnished-seemingly with cellulose- this was done to paper maps without linenbacking. The standard size of the War Chart without margins isroughly 27 inches by 19 inches.ADMIRALTYprintings of the 1 inch OS -Seventh Series:Theseare uncommon, use a cover indistinguishable from Civilian OrdnanceSurvey, but their linen backing is more robust and the printingdetails give the civilian publication date, normal reprint dates andthen the words : “PRINTEDBY THE HYDROGRAPHER OF THE NAVY” witha date. It might be assumed that these were coastal charts used forinshore water duties, maybe boat rescue, Air-Sea Rescue, fisheriesand Coastguards. But one was found for Appleby Westmorland: it had nosea at all and no lakes of note- so their use is something of amystery. Generally, cooperation between Admiralty Charts and OrdnanceSurvey was long-standing and sometimes cited on the map sheet: seenotes of Jersey Maps. Themain grid is National Grid and is set from Point 00, south west ofLands End. But there are also a grid in degrees north and east-westof Greenwich marked with a light cross- the grid has 5' squares (fiveminutes: a minute being a 60th of a degree). This "truelongitude-latitude grid" is also marked on land but is difficultto see- it becomes a major feature of the hydrography. On land thiscross might be confused with a symbol for a site of antiquity or achurch without a spire: but it is longer and lighter than those.RAFMAPS: THESE USUALLY USED THE ¼ INCH TO THE MILE SCALE: They tend tocite the Ordnance Survey but not the General Staff geographicalService. War Office. They often use purple in an orographic manner(graded to express altitude). This must be something to do withcolours in night vision and reduced light. They cite some interestingfeatures which were important for aeronautical navigation such asGolf courses and white horses. They show sea lights and aeriallights, mark the air stations and “landing grounds” and havesymbols for sea plane stations, airship hangars and airship mooringposts. They also cite, in red bombing ranges, shelling ranges, andartillery. They unlike GSGS maps are always marked “Secret” or“Not for Publication”, in red and have lists of elaborate signcodes for light beacons. These are not common.ORDNANCESURVEY FOR SCOTLAND.Insome series this is treated as a different survey with differentlettering and numbering systems. On War Maps this is the case (1”small sheet, blue, purple grid) and when a map crosses the Border-for example the sheet “ Solway-Gretna-Longtown”- it has twonumbers, one for the Scottish Survey and one for the English andWelsh Survey. However, how much the two Surveys were ever independentis a debatable point and will be noticed that the Ordnance Survey ofScotland Maps are published by the Director General from eitherChessington Surrey or Southampton, Hampshire. The covers on VintageOS maps were different; the English and Welsh Surveys showed theRoyal Arms not the English Arms, the Scottish Survey showed the LionRampant, not the Quartered Arms of the Monarch in Scotland, whichwould have been the Lion Rampant 1st and 3rd, Three Lions 2nd andHarp 4th with the supporters of the Scottish Arms; the implicationmight be that the Ordnance Survey of England and Wales was underRoyal Patronage, where as that of Scotland was not. From Series 7onwards Scottish OS maps used the same hinged cover system as EnglishOS maps- prior to that Series Scottish maps had a concertina coversystem. Scottish series 7 maps still retain the Lion Rampant arms.ORDNANCESURVEY OF IRELAND:Thiswas headquartered at Dublin and had some differences with the Englandand Wales Survey. They prefered the floating cover system of theScottish Survey. They tended to default to Anglo Irish as a languagerather than Irish and thus one gets the impression that many placenames are transcribed and the gaelic is not at all pure. The datumwas 21 feet below a mark on the Poolbeg lighthouse in Dublin Bay- sothis was a true Irish Survey. They either ignore fathoms andbathymetric data altogether or use fathoms for both coastal watersand inland loughs- this the British Surveys did not do. They producedvery fine electrotypes with letterpress at the turn of the century-often 1” maps were quite local and about 30 inches by 14 inches.The hydrography was particularly good using linear shading pulledfrom a blue intaglio plate. After the Revolution the Southern IrishOrdnance Survey continued for many years to sell (perhaps produce)Pre Revolution sheets still dated and ascribed to the OSI and printedat Southampton, and still in electrotype. These even appeared in thecovers of the Learscailioct Eireann to which they suffixed the wordsin brackets (Ordnance Survey) One is not a translation of the other-the Irish translates better as “Map Survey of Ireland”. But intheir address they continued to use the old United Kingdom term“Oifig na Suirveireacta Ordonais”. They were based at Pairc anFionn-Uisce (Phoenix Park- Fionn Water) Baile atha Cliat (Dublin).The standard of the UK Ordnance maps was maintained until the 1940sbut Post War the lithography was not good. I think the country reliedmuch more on the Bartholomew's Irish Sheets- which were very good-than did the residual UK. The Northern Irish Survey broke off fromthe Learscailioct Eireann and continued with a more UK style Ordnancemap series- but their folded format for their one inch maps was muchbigger than those of England, Wales and Scotland.JERSEYThe1914 Jersey Survey produced a non-standard 2 inch to the mile mapwhich used contours and a tan shading to display the geology of theisland. It referred back to 1900-01. The covers were pictorialshowing a scene from the Island. Prehistoric sites and old forts wereshown and the Jersey Railway was an important feature of the easternside of the island. The map was corrected in later years withreference to the Admiralty charts and this, plus the manner ofprinting and presentations- suggests that it was always envisaged asan aid to sailors and as a map for visitors. The rocks of the Jerseycoast and the marine lights were recorded in a manner reminiscent ofthe detail of a marine chart. The map was folded and had hingedcovers, and a smaller format when closed.SCILLYISLANDSArare map, the example described is 1933- Scale 2 ½ inches to themile, geologically coloured-with ochre and light shading to representthe hills, orange contour lines. Map 25 ½ “ x 22 inches- allcoloured roads are ochre- either solid or dashed- minor tracksuncoloured. This is called a Special District relief Map- Woodland isgreen. The Admiralty is cited for the submarine contours. The grid is1-4 of longitude from west to east and A to C of latitude from northto south. Grid squares are 5 ¾ inches or perhaps 3 miles in eachdirection. Drawn on a Transverse Mercator projection- the boundariesmarked at sea are parish borders. Published from Southampton inhinged fawn card covers with a red block printed Royal Arms called“Fifth Relief Edition Isles of Scilly” under the auspices of theMinistry of Agriculture and Fisheries.Alater Scilly Isles Survey was in 1/4” scale and it is interestinghow much difference there was between the names on this map and thoseof the earlier one.THENATIONAL GRID.TheSTART POINT is called the “datum” and is a little to the southwest of Lands End and then all the pointsin England and Wales (later Scotland) are pin pointed in reference toeast and north of this point. The datum is fixed so that the ScillyIsles can be included on the survey; essentially the Scilly Islesdefine the position of the datum.Thefirst pre metric National Grid used 5000 yard squares ( about 2 ¾miles) The datum was 00 off S. W. Cornwall. Thus Fittleworth wasexpressed as 1, 110, 000 yards east. This system was used to the end ofSeries 5 maps, that it up until the 2nd World War. It seems thatmilitary (Army) usage in the 1920s prompted the OS to convert tometric measurements. This same point "00" later formed thedefault position for a grid of 10 km squares, subdivided into a 1kmgrid, drawn parallel to a North South line through Point 0. Theeastings are then given followed by the northings to pin point anyplace. A 4 letter reference gives you a point within 100metres. a 6letter reference give a point within a metre. On a very local map youcan scrap the 100s of kilometre number- and give just 3 numbers 356-532 for example : square 35.6 east and square 53.2 north. Of courseyou cannot portray a globe accurately in this way and so thedistortions by the time you are in say Berwick, Cromer or Shetlandare quite considerable. This may have been the logic behind Scotlandhaving its own perspective point and grid which seems to have ceasedin series 6. It seems logical that eastings would distort more thannorthings; a northern line from Start Point 0 is correct irrespectiveof its length- though “true north” moves on a planet whichwobbles in its yearly orbit. Longitude line east of Point 0 shouldconverge. The National Grid does not show Mercator grid elongation.The National Grid perhaps shows that cartography is an art ofconvenience, and subjectivity as much as a science. When this systemwas introduced, it was explained in full on the inside of the frontcover- Series 6 was contemporary to its introduction, and all Series6 maps carry this explanation.Theterm “datum” is also applied to the point from which altitude isdefined. This was at LWMMT Liverpool until 1915, then at LWMMT NewlynTidal Observatory in Cornwall- thus a pre and post 1915 map will havedifferences in measured heights of fells and mountains(the degree towhich Liverpool and Newlyn do not concur). The Irish Ordnance Surveyused LWMMT on the Dublin Bay Lighthouse. In hydrography, the depth ofinland waters (lochs and lakes) are measured in feet and coastalwaters in fathoms. The Irish Survey used fathoms for both inlandwaters and coastal waters. Hydrographic depth is rarely given forreservoirs, small lakes and tarns, or altered lakes such as Thirlmereand Haweswater. This may. In part, be because the Bathymetric Surveyof circa 1870-1903 was not repeated. Also reservoirs have no standarddepth. Smaller meres and tarns tend to have a figure which describesthe altitude of the surface of the water above the LWMMT datum.TouristMaps:Theseare perhaps the most attractive of the OS series combining“orographic” colour and contour- the early ones were intaglio andthe series was substantially lost in the 2nd World War due to BombingDamage. The Lake District was the only Master which survived thedestruction. The Post War Tourists' lithographic maps were 1”and the orographic colour is quite different from that ofBartholomew- more high key, brighter. The mapping is “hybrid”, having relief colour, contour and shading- they tended to have thelarge format of 41” by 33 inches and the covers were particularlyattractive in the early 19th century with period graphics evoking theage.Thefirst Post War versions were interesting- revision 1950-51, publication 1958- amended to 1963. irrational geological shadingfroim three suns casing shadows on the south south east and southwest side of fells. They omitted YHA (perhaps as part of theirongoing feud with Bartholomew's who always showed them)- and theyonly produced 7: 4 in England and 3 in Scotland with perhaps the Wyeand Lower Severn being the least usual and unexpected choice. These 7are useful because they catch the old railways prior to closure. LakeDistrict is particularly interesting here as it is known to be theonly post-bombing survivor. Also Bathymetric readings areinteresting: omitting all the “improved” or “artificial”lakes: Haweswater, Thirlmere- suggesting this Bathymetric survey wascontemporary to that of the Scottish Lochs: 1897-1903 and had notbeen re-surveyed since.Thecovers of the 1960s were a little bland and perhaps did not dojustice to the excellent maps within which aspired to the conditionof art as well as documents of information.Thetourist series of the 1960s covered these titles: BEN NEVIS AND GLENCOE, CAINGORMS, DARTMOOR, EXMOOR, GREATER LONDON, LAKE DISTRICT, LOCHLOMOND AND THE TROSSACHS, NEW FOREST, NORTH YORK MOORS, PEAKDISTRICT, SNOWDONIA.Themulti plate coloured intaglio printing of the Early 20th centuryTourist series represents perhaps the most interesting an attractiveof all Ordnance Survey maps.VeryRare maps: there are several but two are the semi mythical Engravedmaps with railways before electrotyping and the 1927 Eclipse Map withpictorial cover- A map for a one day event.Trig-Point: Spot Heights. The Ordnance Surveybuilt these between 1935 and 1962. In flat land where heighpoints were not to be had for survey work the Survey built temporaryhigh points with "Bilby Towers".
FOLDINGOS MAPS:Thestandard way is: fold the map horizontally, then concertina the maplaterally, Fold in half. (If the lower information border isseparately folded, that is done first.) Scottish OS maps used afloating cover system, as did Bartholomew of Edinburgh. Often thefront and back boards of a concertina-folded map were not on the samehorizontal line of folds. The OS Motorcycle Maps have floating coversas well. Theadvantage of the Scottish system was that one did not get hinge wearon the cover. The disadvantage of the Scottish system was that thereis no spine with map details readable from a library shelf. ScottishOS maps used hinged covers from Series 7 onwards.